Success in a business requires constantly facing and overcoming challenges. Overcoming them requires leaders to make critical decisions every now and then. Good decisions lead to growth and success; in contrast, poor decision-making can lead to catastrophic failures. Decisions are never made blindly; they are usually based on the insights gained from observing various parameters and numerical values that offer valuable information on the performance of the various aspects of projects, teams, and the organization as a whole. Leaders have to analyze the data and consider various implications while making decisions.
Time is the scarcest resource and unless it is managed nothing else can be managed.

It requires special monitoring tools to collect data and KPIs and visualize them in such a way that they make sense to the business. When you are managing different projects, you may also have various stakeholders. It is essential to share relevant insights with them to create understanding and consensus among the stakeholders and to get their feedback for better decision-making. Tableau is a software used for this purpose.
Tableau Dashboard explained:
Tableau is one of the leading industry standard tools that helps visualize data and provide comprehensive business insights for data-driven businesses. It connects to various data sources, derives data and helps visualize them in a meaningful way, and enables you to share the same with others. It empowers users with the ability to interact with the data and collaborate in real time for quick decision-making. Users can customize their space on the tool and visualize data using the Tableau dashboard.
A Tableau dashboard ensures that the most relevant data is captured and visualized to aid in the decision-making process. Users can customize this dashboard according to their specific needs and can compare various data points and build new insights from them that provide more clarity. This tool also helps generate worksheets and reports that can be shared with team members and stakeholders to allow for more organizational transparency.

Key features of Tableau Dashboard
A Tableau dashboard provides you with:
1. Insights:
The Tableau dashboard generates an array of worksheets and helps you make sense of data at various levels. It helps you to toggle through different views and gain thorough insights to your business, as well as analyze data quickly and gain a better understanding of your data.
2. The ability to process data and simplify it:
The Tableau dashboard processes and simplifies data in such a way that even people without any technical knowledge can make use of it without having to go through a steep learning curve. It also combines various types of data to help build a bigger picture of the business based on precise insights built from comparison of diverse data points.
3. The power to share:
Tableau dashboard enables you to share your visual insights to collaborate with team members, report to other stakeholders, or review with your team in order to make more informed and data-driven decisions.
4. Ability to connect to various data points from various sources:
Tableau dashboard enables you to connect various data sources to their platform. Your team can pull information from spreadsheets, the cloud, and even other software, providing a 360 view of your data on one advanced tool. Tableau securely connects to your external data sources so you can monitor your information with confidence.
5. Visualize insights using various tools
Tableau dashboard lets you use wizards with step-by-step instructions to visualize data and drag and drop relevant features for visualization such as:
- Charts
- Graphs
- Maps
- Tables
- Plots
- Bubble clouds
- Cartograms
- Heat Maps
- And more.
Profit.co’s OKR management tool enables you to make your Tableau insights more actionable with a seamless software integration that allows you to track key results using data directly from your Tableau account. To try out this integration and so much more, get started on the Profit.co software free today!
How to share Tableau Dashboards
There are various ways in which you can share Tableau dashboards.
1. Offline sharing
If you want to share a Tableau dashboard offline for another team member or a stakeholder to open on his/her device using a Tableau reader, you can use this method. In this method, you have to create the worksheets and dashboard with Tableau desktop. Then, choose the ‘Export packaged workbook’ option to bundle everything together in a file along with the instructions on how to view it, and share with your team members offline.
The package also contains a snapshot of the data available at the time of exporting. Data on this file will only be as recent as the export– so if the information in Tableau has changed by the time the offline document is opened, the recipient won’t be able to view the most recent data.
2. Online sharing via the web
If you want to share a Tableau dashboard, workbook, or story online publicly, you can choose this option. You can navigate to the content you would like to share and publish it publicly. Then, you can share the link with individuals and teams outside of your company, or even on social media.
This method is a great way to spread useful information and build your company’s credibility in a certain market or subject. Tableau information should only be shared publicly when it does not contain any sensitive business-related information. When used appropriately, this is a great way to signal to your audience that you are a learning organization.
3. Private sharing on cloud
You can privately share workbooks and other content on the Tableau server, which comes with different licensing plans for you and other end users, so that you can scale your Tableau solution according to your exact needs as a team.
The process of publishing a Tableau dashboard on the cloud privately is similar to sharing it publicly on the web; but it comes with advanced sharing permissions to make sure that the file is shared with only those you mean to share it with. This is just one of the many ways that Tableau helps keep your information secure.
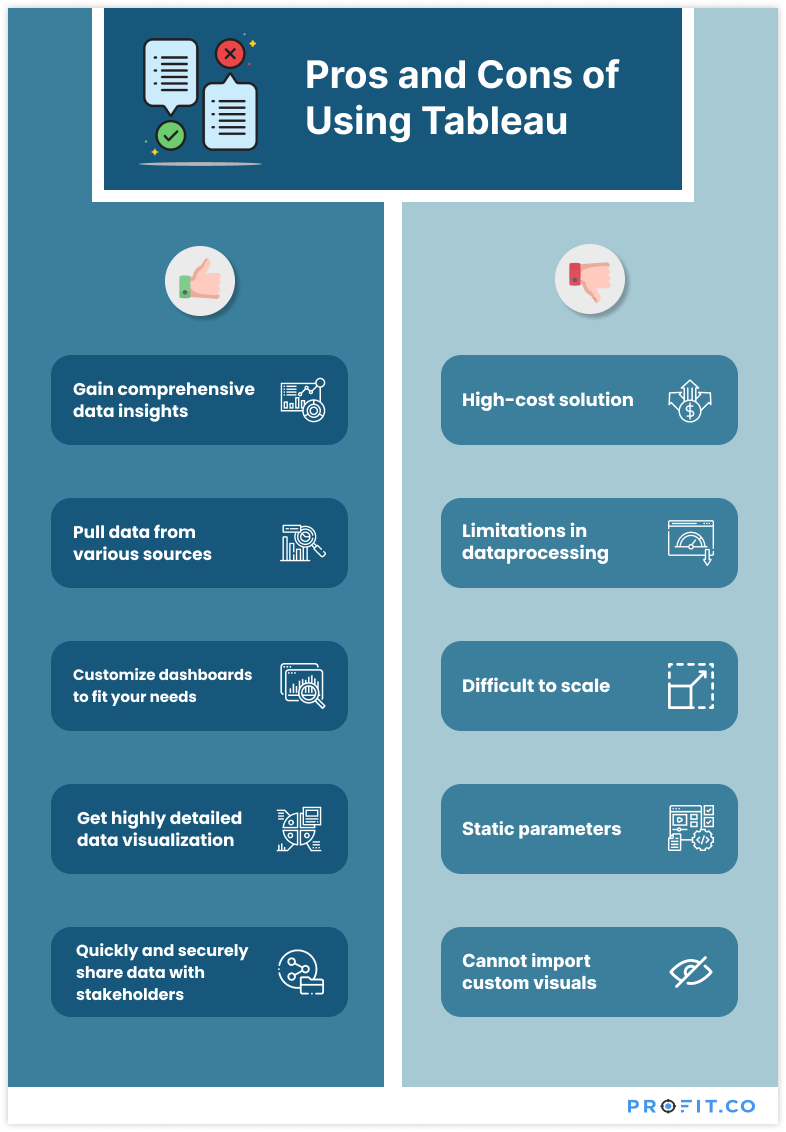
Advantages of Tableau dashboard
Using Tableau has many advantages that give your company a leg-up in the market. Here are some of the benefits of using this tool:
- Comprehensive insights
- Highly detailed visualization
- Mix and match data to build a bigger picture of the business
- Pull data from various data sources
- Visualization of centralized data
- Highly interactive visualization
- Quick, responsive, and easy to use
- Comes with filters to narrow down insights from specific data and parameters
- Built-in KPIs and metrics
- Enables quick sharing with various stakeholders
- Descriptive texts and multiple annotations
- Highly secure data handling
Disadvantages of Tableau dashboard
- High-cost solution
- Limitations in data processing
- Problems in scaling
- Static parameters
- Cannot import custom visual
- The number of columns in the table is limited
Creating dashboards in Tableau
Creating dashboards in Tableau involves:
1. Clicking ‘new dashboard’ button at the bottom of the Tableau desktop to create and name the new dashboard
2. Drag-dropping sheets to the dashboard
3. Adding introductions to the dashboard and customizing it using filters, colors, graphs, text objects, images, web pages, etc.
4. Viewing the dashboard and verifying the look and content of it
5. Sharing the dashboard with stakeholders, team members, etc., using different sharing options and collaborating for work
Final Thoughts
Tableau can be a highly effective way for your company to store and monitor data in a way that enables more data-driven decision making. With customizable dashboards, your team can gain insight into the health of the company and judge what their next steps should be in order to bring the company to new heights.
When you combine Tableau with a tool such as Profit.co’s OKR Management software, your business can begin making substantive progress on your long-term strategic goals. The first step to improving your business and reaching your goals is knowing what you need to measure. With a data insight tool like Tableau, and Profit.co’s KPI tracking capabilities, you will be able to identify your most important business indicators, set ambitious goals, and align your team so you can achieve more, more efficiently.
To learn more about how you can integrate Profit.co with all your favorite business apps, book a free demo with our OKR experts today!