
While success is a common concept that many people envision for themselves, it doesn’t have a universal definition. Because of this, you must spend some time considering what success looks like in your specific organization.
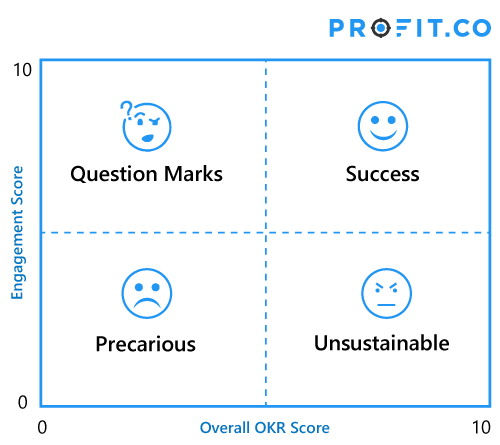
To illustrate the definition of success, business leaders can use a sustainable growth matrix, with business results on one axis and eNPS, a KPI measuring employee engagement/satisfaction on the other axis. This OKR scorecard can help demonstrate where a business currently stands, and what they would need to do in order to be successful.
On the horizontal axis, there is the overall OKR score, representing what the business has achieved over the defined period. This number is transparent and available to everybody. You can grade OKRs using many different scales, however OKRs are commonly depicted on a 10-point scale.
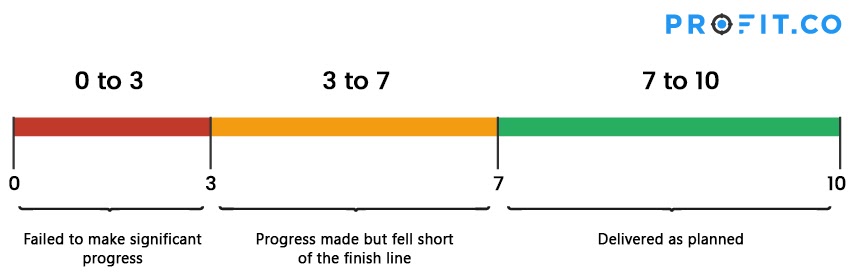
In general, the score ranges that are generally accepted are:
- 0 to 3 → Failed to make significant progress.
- 3 to 7 → Progress was made, but it fell short of the finish line.
- 7 to 10 → Delivered as planned.
On the vertical axis, there is the Employee Engagement score.
The employee engagement score is computed from an eNPS survey.
eNPS is the short form for the Employee Net Promoter Score, which originated from NPS or net promoter score.

In an eNPS survey, you ask employees to agree or disagree with one simple statement: “I would refer this company to my friends to join and work”.
The answer is typically on a 5-point or 10-point Likert scale where the lowest number means strongly disagree, and the highest number means strongly agree. The engagement score is simply an average of all the responses, either at the company-level or at the department-level. ENPS respondents are split into 3 different groups: Detractors, Passives, and Promoters.
If you have elected to measure eNPS on a ten-point scale, detractors are individuals who responded between 0 and 6, passives are those who scored at a 7 or 8, and promoters are those who scored at a 9 or a 10.
An integrated OKR and employee engagement software can help you create OKRs that matter to your employees, and keep them engaged throughout the quarter. Profit.co can help you achieve more and better connect with employees, no matter where you are in the world. You can get started for free today!
Where is your company or department positioned on your OKR scorecard?
When you take your company’s overall OKR score and the engagement score and then plot it on the OKR scorecard, you’ll know if you are on a sustainable growth trajectory or if you need to make changes within your organization or strategy in order to course correct.

Below are some approaches to getting your business on this sustainable growth path.
An ideal way to get started is to plot your departments or business units in this matrix and see how they fare. If one team or department is showing signs of trouble in their OKRs or employee engagement, you will know where your focus and resources need to be.
OKR Scorecard Quadrant I: Question Marks
If one of your departments has a high engagement score, but a low OKR score, they would sit in quadrant one of your OKR scorecard. This quadrant is called the “Question Mark” quadrant, because employees are reporting high job satisfaction, but low productivity. A team in this quadrant could either mean:
- The targets set through the OKR process were tough, and the department employees are superstars and know that they have got the toughest challenges. They also know that they need to do their part, and the department will see better results in the coming quarters. It is not an ideal situation; however, that could potentially change for the better. Double check OKR targets to determine if this is the issue.
- Another possible explanation is that these employees are not properly trained or informed, and there is a severe information disconnect in your organization. Though their goals are reasonable, there’s no substantial progress— employees could misunderstand what they are expected to do, and not realize that their performance is lagging.
When a department or team falls in this quadrant, you should approach the situation carefully and critically. You want to preserve their high engagement and satisfaction, but must figure out why performance is lagging so far behind expectations.
OKR Scorecard Quadrant II: Success
Quadrant II of the OKR scorecard is the sustainable growth or success quadrant. Departments land in this quadrant when they have high OKR scores, as well as high engagement scores. This quadrant is ideally where most of your departments, if not your entire business, should be. For most businesses, this is what success looks like; the organization is achieving its goals while employees are highly engaged and motivated.
OKR Scorecard Quadrant III: Precarious
If a department or team has low OKR scores, and low engagement scores, then you know that your business is in a precarious situation.
Not only is this department not achieving the expected business results, but employees are neither motivated nor engaged in their work. Low scores on both axes would place a department in the third quadrant. Businesses in this situation should make significant changes as soon as possible. Higher-level leadership should step in to help department or team leaders clarify goals, realign employees, and increase employee engagement in your workplace.
OKR Scorecard Quadrant IV: Unsustainable
If a department has a high achievement score on their OKRs, but a low engagement score, they will land squarely in the bottom right quadrant, or quadrant four. This usually means that employees are overworked, and it should be investigated and addressed.
While high achievement levels are something every business leader wants to maintain, they must be supplemented with employee engagement activities. Lack of engagement could come from poor compensation, stressful managerial culture, long work hours, and more. All of these are reasons an employee might choose to leave their job, so it’s important to address this situation immediately.
It may just be that employees are working over their regular hours to get to their high-targets, and do not feel like they are being valued or compensated enough. In this case, it’s time to congratulate employees on their hard work, and promote better engagement with bonuses, perks, and positive feedback.
Final Thoughts
Because OKRs are developed depending on the strategic goals of the organization, and are measured using the KPIs a company has identified as the most important indicators of the business’s health, they give users a crystal clear view of organizational progress and success. When you consider OKR progress with regard to employee satisfaction, you might find that your business isn’t where you want to be. When your OKR program is managed properly, however, then both OKR progress and employee engagement should increase. So if you find yourself in a quadrant you’d rather not be in, it’s time to take a hard look at your OKR adoption strategy.
To find out how an OKR software could help you create well-structured OKRs and boost employee engagement, schedule a free demo with the OKR experts at Profit.co today!